|

|

|
|
|
|
|
|
|
performanceIn this page a small analysis to BERSERK's performance is made. Please do not start flame wars about this. Keep in mind that each hardware and software configuration may produce different results. The test consists in running a service that multiplies two matrixes. The goal is not to show whether the multiplication time is affected, but to find how much the global execution slowed. introductionBefore actually look at the results a few previsions can be made. The first execution via BERSERK is likely to be much slower because the definitions will be read. Thus, all the input/output operations represent an overhead to the matrix calculation. However the second execution should not be as slow as the first one because of BERSERKís cache. From second execution on, all the extra time in BERSERK framework is spent in introspection and climbing indirection levels. test setupTests were run on an Intel Pentium III, 800 MHz, 512MB Ram. The service to test, as mentioned, consists in a matrix multiplication. The code is as follows public void run(Matrix matrix_1,Matrix matrix_2)
{
int i, j, k;
int dim = matrix_1.getDim();
int[][] matrix_3 = new int[dim][dim];
for (i = 0; i < dim; i++)
{
for (j = 0; j < dim; j++)
{
for (k = 0; k < dim; k++)
{
matrix_3[i][j] =
matrix_3[i][j] + (matrix_1.getPost(k,j)) * matrix_2.getPost(i,k);
}
}
}
}
The service is filtered by the chains described in the previous chapter, allowing the evaluation of the weight of filtering too. To compare times, a direct invocation of the service is also done. That is, accessing the service directly by instantiating the service class. The access control and logging is also done directly. Basically filters code is inlayed in the service invocation. The matrix size is fixed (256) because its size has no influence on BERSERK framework. The matrixís cells are randomly filled before the tests begin to run. Every test uses the same two matrixes. The test is run 30 times simulating heavy traffic requesting the service results
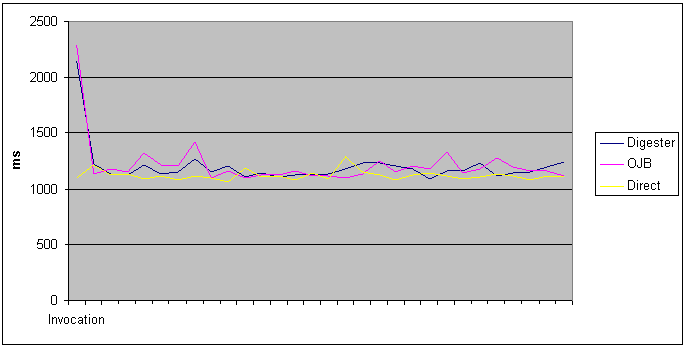
Like it was predictable direct invocation is always faster, since no introspection is needed. In the first invocation both Digester and OJB brokers need plenty more time to multiply the matrixes. Obviously the time is not spent doing the calculations but initializing BERSERK framework. The table below shows the total time spent in the three methods:
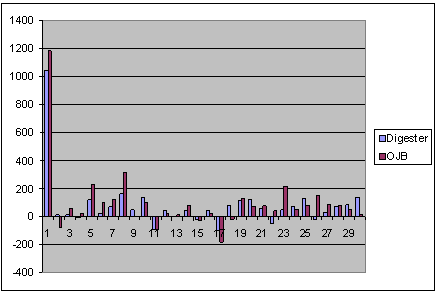
More accurate conclusions can be taken calculating the amount of extra time spent by BERSERK when comparing to direct invocation:
The table below displays the amount of extra time spent by OJB and Direct methods (when compared to direct invocation):
Even though performance criteria vary from person to person, it can be pacifically concluded that for most systems the overhead (around 2.5 seconds) is tolerable. Particularly if a first request is made by the deployer, all the subsequent invocations will have even smaller overhead. This method can be applied to Fťnix, since BERSERK initialization (and therefore all configuration readings) can be included in the Context Listener; that is, initialization is done when Fťnix is deployed in the managed environment.
The previous shows extra time spent when not taking the first invocation into account. The first invocation takes 5% of total execution time when using Digester, and 6% when using OJB. This shows that with few filters and definitions (typically small applications) Digester method has better performance. However, with large data Digester method execution time tends to grow faster than when using OJB. |
| © 2003, GonÁalo Luiz | 
|